The True Price of a Claude Max Weekly Limit (in API Dollars)
Anthropic reports weekly utilization as a percentage. But a percentage doesn’t tell you what a full week is actually worth in dollars. I tracked both sides — actual API-equivalent costs per task and the utilization percentage — simultaneously, across 80 autonomous coding tasks. Here’s what a full weekly limit costs in real money.
The Missing Link
There are tools that track your Claude Code token usage. ccusage parses local JSONL files and gives you daily/monthly cost breakdowns. The Claude Code Usage Monitor shows burn rate in real time.
None of them answer the question: if I’m at 23% weekly utilization, how many API dollars is that?
To connect the two, you need a system that records token costs and utilization snapshots simultaneously and correlates them.
How I Measured
I run Botfarm, an open-source dispatcher that assigns tickets from Linear or Jira to Claude Code agents. Each agent runs through a pipeline — implement, review, fix, push, merge — and reports back token-level usage including per-model cost breakdowns. Separately, Botfarm polls the Anthropic usage API every ~60 seconds and stores snapshots to SQLite.
By comparing cumulative task costs against the change in weekly utilization, I can calculate the dollar value of 1% utilization — and extrapolate to a full limit.
I measured across two consecutive weekly cycles on different plans:
- Max 5x ($100/mo): Feb 27 – Feb 28, 2026
- Max 20x ($200/mo): Feb 28 – Mar 1, 2026
Both periods start from an observed reset of the 7-day utilization to 0%.
The Numbers
Max 5x ($100/month)
| Metric | Value |
|---|---|
| Measurement window | 21 hours |
| Tasks completed | 32 of 33 |
| Pipeline stage runs | 189 |
| Total computed API cost | $152 |
| Weekly utilization consumed | 28% |
| Cost per 1% utilization | $5.44 |
| Estimated full weekly limit | ~$523 |
Max 20x ($200/month)
| Metric | Value |
|---|---|
| Measurement window | 46 hours |
| Tasks completed | 42 of 47 |
| Pipeline stage runs | 308 |
| Total computed API cost | $253 |
| Weekly utilization consumed | 23% |
| Cost per 1% utilization | $10.99 |
| Estimated full weekly limit | ~$1,100 |
The Ratio
| Plan | Weekly limit value | Monthly (4.3 weeks) |
|---|---|---|
| Max 5x ($100/mo) | ~$523 | ~$2,250 |
| Max 20x ($200/mo) | ~$1,100 | ~$4,730 |
| Ratio | 2.1x | 2.1x |
The $200 plan gives you roughly 2x the weekly API-dollar budget, not 4x. My companion analysis of the 5h-to-weekly limit ratio measured this from a completely different angle and arrived at the same number. Two independent methods, same result.
Subscription vs. API Pricing
Even at these lower-bound estimates, Max 5x gives you $523/week of API compute for $25/week (subscription cost) — roughly 20x the value of paying API rates. Max 20x gives you $1,100/week for $50/week — about 22x.
Breakeven: if you’d spend more than ~$25/week on the API, Max 5x saves money. More than ~$50/week, Max 20x does. Most developers who use Claude Code daily are well past this threshold.
Per-Task Cost Breakdown
Since I have per-task granularity, here’s what autonomous coding tasks actually cost in API terms:
By pipeline stage
| Stage | Avg. cost per run | What it does |
|---|---|---|
| Implement | $2.66 | Write code, tests, commit |
| Fix | $1.34 | Address review feedback or CI failures |
| Review | $0.57 | Review changes, generate feedback |
Implementation is the most expensive stage — roughly 55% of total cost. Review is cheap because it produces less output. Fix stages accumulate because review/fix loops can iterate multiple times.
For context: Anthropic recently launched their own Code Review product for GitHub PRs, which their head of product estimated costs $15–$25 per review on API pricing. Botfarm’s review stage averages $0.57 in API-equivalent terms — and under a Max subscription, the effective cost is even lower.
By task complexity
| Cost range | Tasks | Typical work |
|---|---|---|
| $1 – $3 | 27 | Single-file changes, small features, config updates |
| $3 – $7 | 25 | Multi-file features, API endpoints, test suites |
| $7 – $13 | 28 | Complex features, E2E tests, multi-component work |
The median task costs about $4–5 in API terms. The most expensive single task across both periods was $13.14 (implementing real-time E2E tests with SSE and auto-refresh).
Caveats
These are lower-bound estimates. I also used Claude Code interactively from the same account during these measurement periods — moderately, but it consumed some utilization that doesn’t appear in Botfarm’s task cost data. The actual dollar value of a full limit is likely higher than the numbers above.
Anthropic’s utilization math is opaque. The 7d percentage is their internal metric. It likely doesn’t weight token types (input, output, cache read, cache create) exactly the same way as published API prices. Cache reads cost $0.50/MTok on the API but may count differently toward utilization.
Rolling window, not calendar reset. The 7-day limit is a rolling window. My measurement periods start from observed resets to 0%, which occur when previous-week usage rolls off.
Model pricing matters. My workload is 95% Opus 4.6 at $5/$25 per MTok. If you primarily use Sonnet ($3/$15 per MTok) or Haiku ($1/$5 per MTok), the dollar value of your weekly limit would be different — though the utilization percentage consumed per task would also change.
Sample size. Two weekly cycles, 80 tasks. Directionally strong, but more data would tighten the estimates. (Anthropic has since throttled my usage API polling, making it harder to collect a comparable dataset.)
How I Got This Data
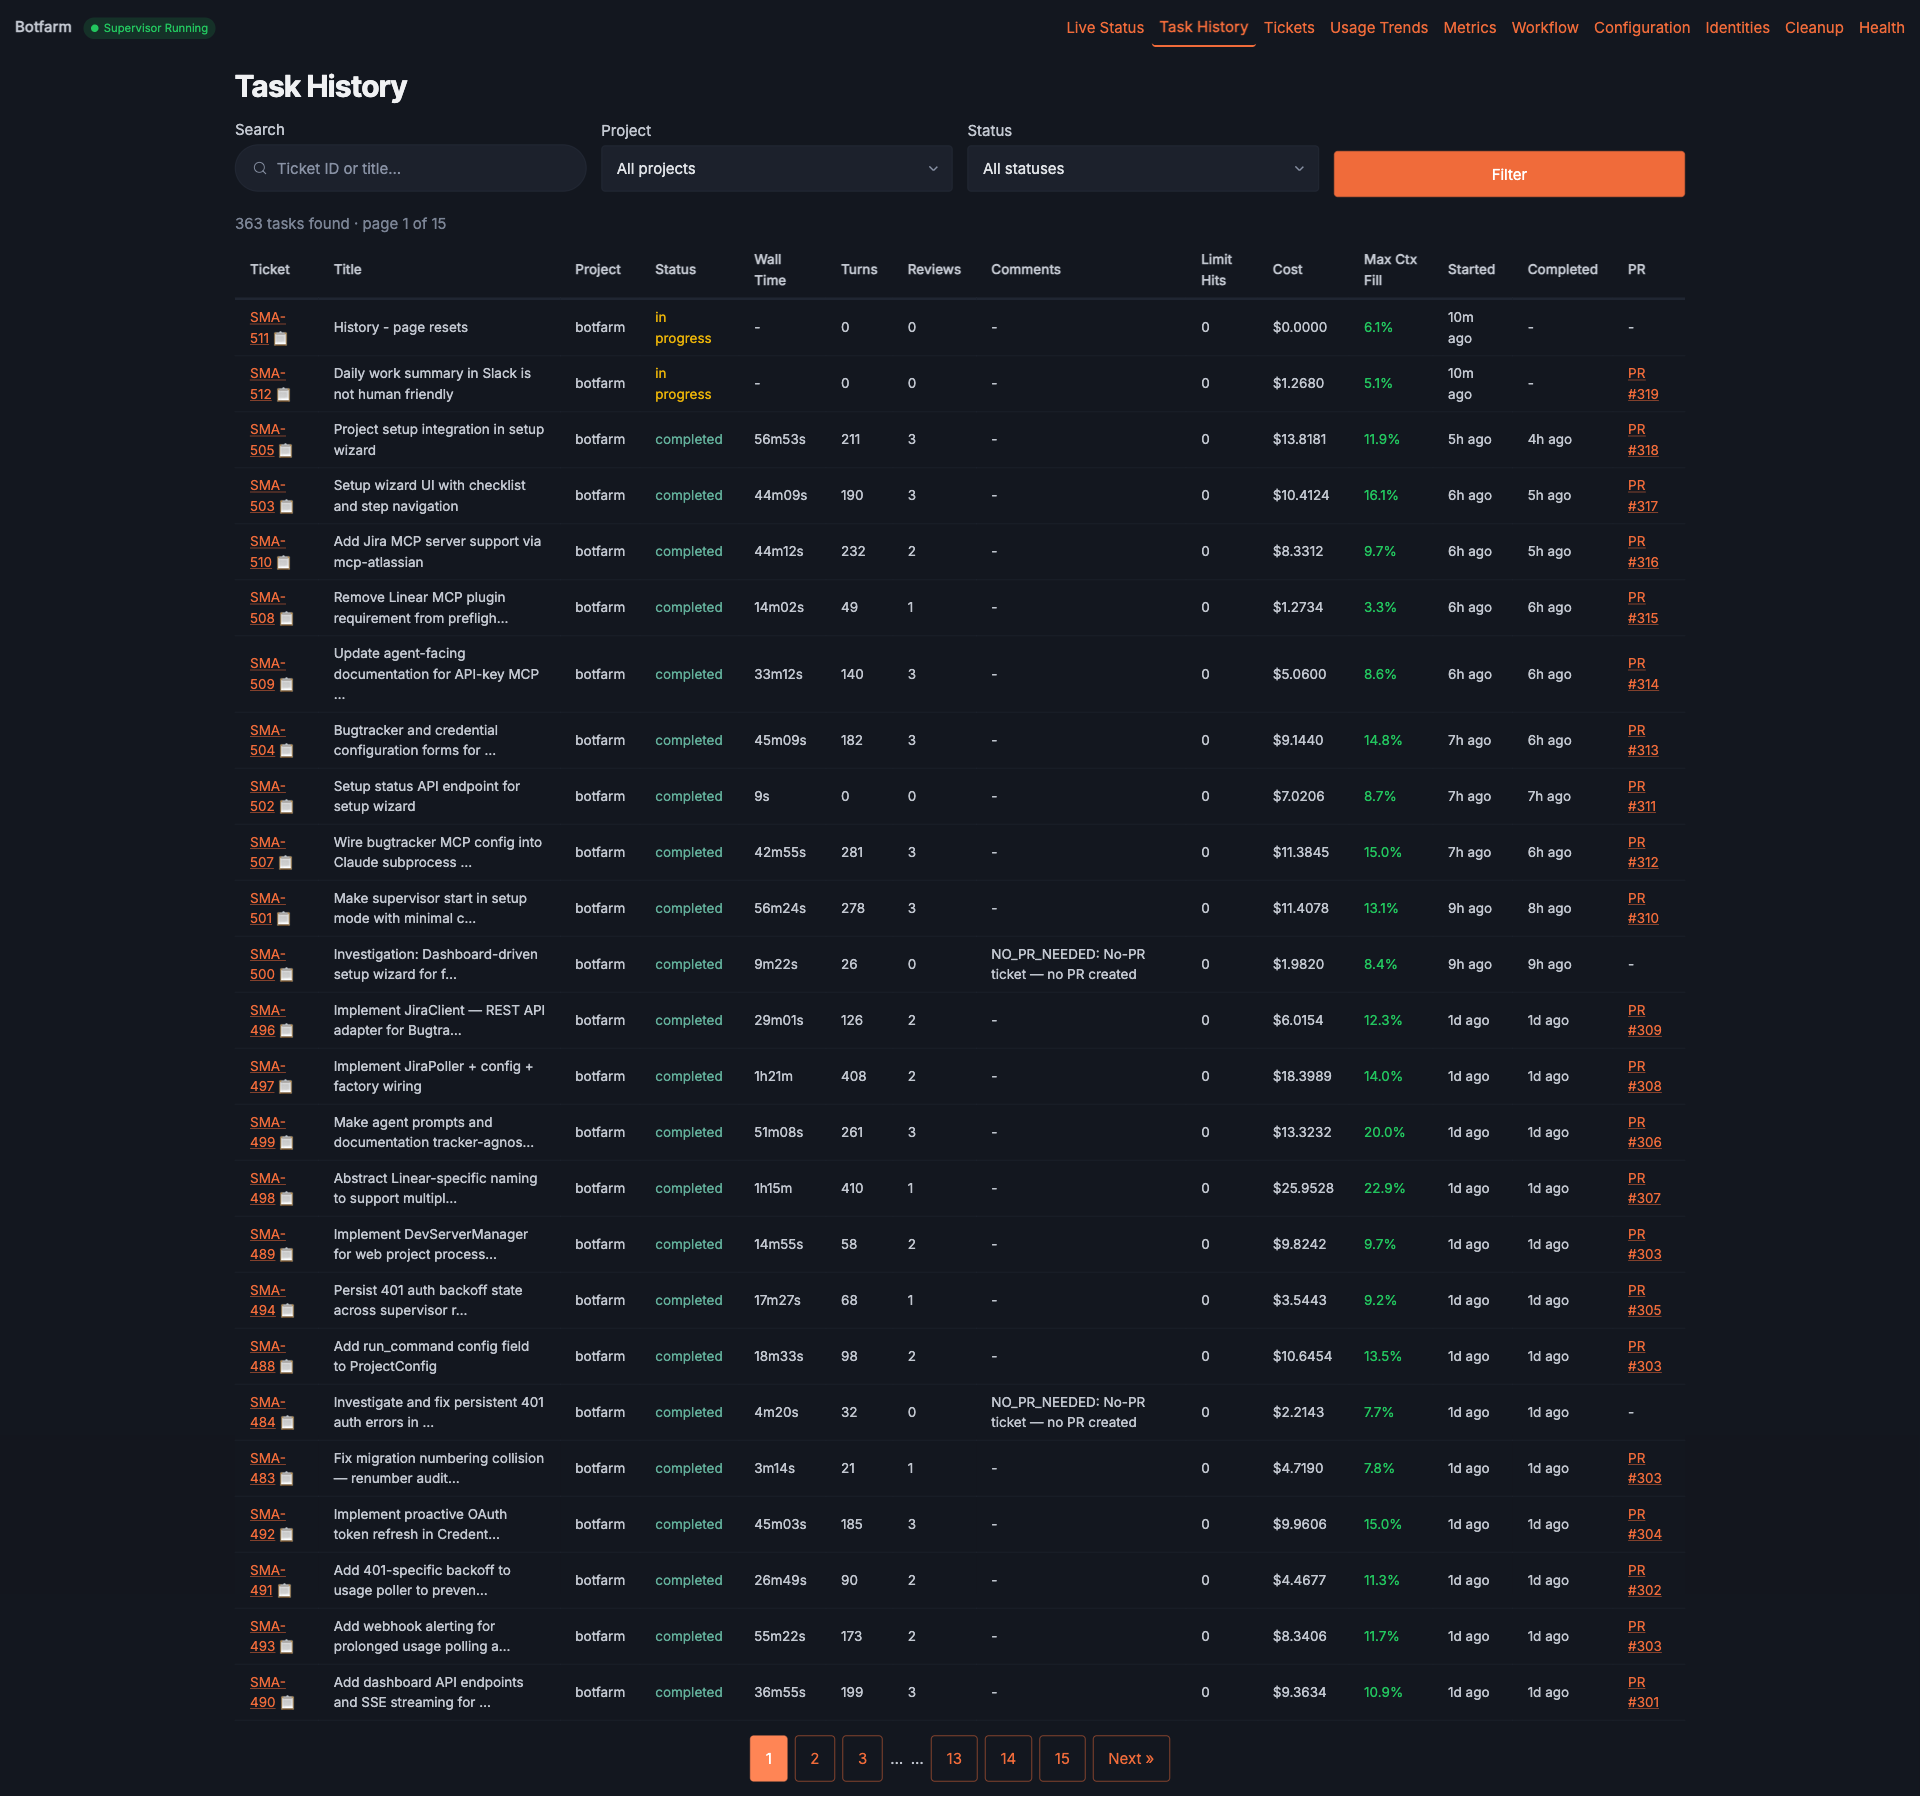
This analysis comes from running Botfarm, an open-source autonomous dispatcher for Claude Code. Botfarm assigns tickets from Linear or Jira to Claude Code agents, manages their lifecycle through multi-stage pipelines, and tracks both per-task costs and usage API snapshots in a local SQLite database. Since collecting this data, Botfarm has completed over 360 tasks across multiple projects.
The usage tracking module and database schema are open source if you want to replicate the analysis.
Based on 80 tasks, 497 pipeline stage runs, and ~3,500 usage snapshots collected between February 27 and March 1, 2026. Companion article: Claude Max $100 vs $200: What You Actually Get.